What AI Voice Agent Metrics Should You Track After Launch?
What AI Voice Agent Metrics Should You Track After Launch?
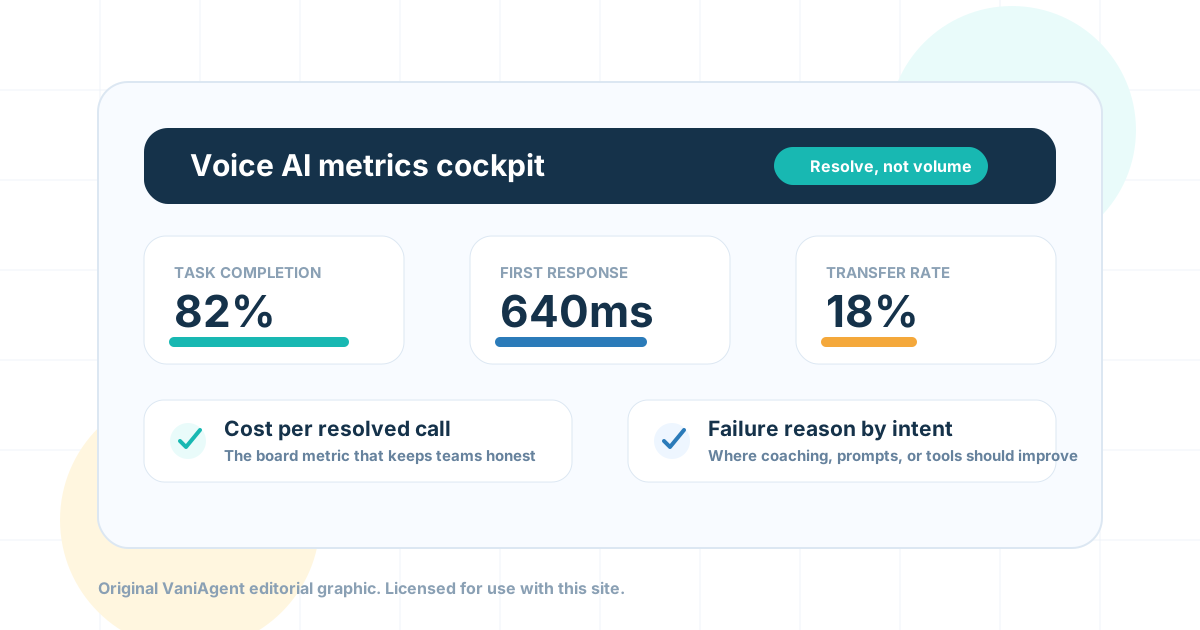
Short answer: Track AI voice agents by outcomes, not call volume. The core metrics are task completion, containment rate, transfer rate, first response latency, tool-call accuracy, interruption recovery, fallback rate, sentiment, repeat-call rate, and cost per resolved call.
If you only measure call volume, you are measuring noise.
That is the line that should sit above every AI voice dashboard.
Call volume tells you the system is being used. It does not tell you whether customers got help, whether appointments were booked, whether payment reminders worked, whether a human had to clean up the call, or whether the agent quietly made mistakes at scale.
The real question after launch is not "how many calls did the AI answer?"
The real question is: "How many customer journeys did the AI resolve correctly, safely, and cheaply enough to matter?"
The three layers of AI voice metrics
A useful AI voice dashboard has three layers.
| Layer | What it measures | Who uses it |
|---|---|---|
| Business outcomes | Resolved calls, bookings, payments, leads, CSAT, cost per resolution | Founders, CX heads, revenue leaders |
| Conversation quality | Intent accuracy, containment, transfer reason, sentiment, interruption recovery | Ops teams and managers |
| Technical health | Latency, ASR errors, TTS failures, tool-call failures, carrier issues | Engineering and platform teams |
Most teams start with technical metrics because they are easy to collect. Mature teams connect technical metrics to business outcomes.
Metric 1: Task completion rate
Task completion rate tells you whether the agent completed the job it was hired to do.
Formula:
| Metric | Formula |
|---|---|
| Task completion rate | Completed target tasks / eligible calls x 100 |
Examples:
- Appointment booked
- COD confirmed
- Payment link sent
- Ticket created
- Lead qualified
- Demo scheduled
- Order status answered
- Human callback booked
Track task completion by workflow. A single aggregate number hides the truth.
| Workflow | Good task completion means |
|---|---|
| Clinic appointment | Appointment booked, rescheduled, or cancelled correctly |
| Ecommerce COD | Customer confirmed, rejected, or requested callback |
| BFSI reminder | Customer heard due date and received payment link |
| Real estate lead | Budget, location, timeline, and visit intent captured |
| EdTech counselling | Course interest captured and counselling/demo scheduled |
If task completion is low, the agent may sound fine but fail commercially.
Metric 2: Containment rate
Containment rate measures how many calls are resolved by the AI without human transfer.
Formula:
| Metric | Formula |
|---|---|
| Containment rate | Calls resolved by AI / total eligible AI calls x 100 |
But containment can be misleading.
High containment is not always good. If the AI refuses to transfer angry callers, containment rises while customer experience falls. If the AI escalates risky finance or healthcare cases correctly, containment may fall while safety improves.
Track containment by intent.
| Intent | How to interpret containment |
|---|---|
| Basic FAQ | High containment is usually good |
| Appointment booking | Medium to high containment is expected |
| Refund dispute | Lower containment may be acceptable |
| Collections | Containment must be balanced with tone and compliance |
| Medical triage | Safe escalation may matter more than containment |
The question is not "what is our containment rate?" The question is "which intents should the AI contain?"
Metric 3: Human transfer rate
Transfer rate measures how often the AI moves a call to a human.
Formula:
| Metric | Formula |
|---|---|
| Transfer rate | Calls transferred to human / total AI calls x 100 |
Do not judge transfer rate alone. Judge transfer reason.
| Transfer reason | What it means |
|---|---|
| Customer requested human | Normal and often healthy |
| Low confidence | Agent did not understand or policy was unclear |
| Tool failure | CRM/calendar/payment system did not work |
| Sensitive case | Correct escalation may be required |
| Angry caller | Agent detected frustration |
| Out-of-scope request | Knowledge or workflow gap |
Transfers are not failures if they are intentional. Blind transfers are failures.
Metric 4: First response latency
Latency is not just a technical number. It is how the caller feels the agent's attention.
Measure:
- Time from caller speech end to AI speech start
- Tool-call delay
- Text-to-speech start time
- Full turn latency
- Long silence events
Twilio's latency guidance explains that voice latency includes speech recognition, model processing, text-to-speech, and the network/telephony path. Your dashboard should separate these pieces when possible.
| Latency metric | Why it matters |
|---|---|
| First response latency | Determines whether the call feels alive |
| Tool-call latency | Shows whether external systems are slowing the call |
| TTS start time | Affects perceived responsiveness |
| Silence over threshold | Detects moments where callers may hang up |
| Latency by language | Hindi/Hinglish may behave differently than English |
A voice agent can have great answers and still lose callers through silence.
Metric 5: Tool-call accuracy
Voice agents often change systems. They book appointments, update CRMs, send WhatsApp messages, create tickets, and trigger payment links.
That means tool-call accuracy is one of the most important metrics.
Formula:
| Metric | Formula |
|---|---|
| Tool-call accuracy | Correct tool actions / total tool actions x 100 |
Track:
- Correct tool selected
- Required fields present
- Phone number correct
- Date and time correct
- Customer identity verified
- Confirmation collected before action
- Tool failure handled safely
| Tool | Accuracy risk |
|---|---|
| Calendar | Wrong slot, timezone, or customer name |
| CRM | Missing lead source or wrong intent |
| Wrong template or wrong phone number | |
| Payment | Wrong amount or unsafe payment collection |
| Support ticket | Wrong category or missing details |
| Transfer | No summary passed to human |
If tool-call accuracy is poor, the agent is not automation. It is automated cleanup work.
Metric 6: Interruption recovery
Real callers interrupt. They correct the agent. They say "no, listen." They change their answer mid-flow.
Measure:
- Barge-in detection rate
- Successful recovery after interruption
- Repeated prompt rate
- Context reset rate
- Caller frustration after interruption
| Interruption scenario | Good behavior |
|---|---|
| Caller interrupts greeting | Agent stops and listens |
| Caller corrects detail | Agent updates context |
| Caller asks new question | Agent routes without restarting |
| Caller says "human" | Agent transfers or schedules callback |
| Caller says "not now" | Agent exits or schedules later |
This is one of the metrics that separates a phone bot from a usable voice agent.
Metric 7: Fallback rate
Fallback rate measures how often the agent gets stuck or uses a generic recovery line.
Formula:
| Metric | Formula |
|---|---|
| Fallback rate | Fallback turns / total AI turns x 100 |
Common fallback causes:
- Missing knowledge
- Poor intent detection
- Speech recognition confusion
- Unsupported workflow
- Tool failure
- Policy uncertainty
- Language issue
Track fallback by intent and language. A high fallback rate in Hindi but not English tells you something specific.
Metric 8: Sentiment and frustration signals
Voice sentiment is imperfect, but useful when combined with other signals.
Track:
- Angry phrases
- Repeated questions
- "You are not understanding"
- Long pauses
- Customer interruption frequency
- Request for human
- Hang-up after AI response
Do not use sentiment as a single truth. Use it as a smoke alarm.
Metric 9: Repeat-call rate
Repeat-call rate tells you whether the AI actually resolved the problem.
Formula:
| Metric | Formula |
|---|---|
| Repeat-call rate | Customers calling again for same issue / resolved calls x 100 |
If containment is high but repeat calls are high, your agent may be deflecting instead of resolving.
Examples:
- Customer calls again after a refund answer.
- Patient calls again after appointment confirmation.
- Lead calls again because WhatsApp link never arrived.
- Ecommerce customer calls again because order status was unclear.
Repeat calls reveal hidden failure.
Metric 10: Cost per resolved call
This is the board-level metric.
Formula:
| Metric | Formula |
|---|---|
| Cost per resolved call | Total voice AI cost / successfully resolved calls |
Include:
- Telephony cost
- LLM cost
- Speech-to-text cost
- Text-to-speech cost
- Platform cost
- WhatsApp follow-up cost
- Human transfer cost
- Retry cost
Do not celebrate low cost per minute if cost per resolved call is high.
The weekly AI voice dashboard
Use this dashboard every week.
| Metric | Segment by |
|---|---|
| Task completion | Workflow, campaign, agent, language |
| Containment | Intent and reason |
| Transfer rate | Transfer reason and human team |
| First response latency | Provider, language, time of day |
| Tool-call accuracy | Tool and workflow |
| Fallback rate | Intent, language, prompt version |
| Sentiment | Workflow and outcome |
| Repeat-call rate | Issue type |
| Cost per resolved call | Workflow and channel |
| Top failure reason | Intent and owner |
The last column matters: every failure reason needs an owner.
| Failure reason | Owner |
|---|---|
| Knowledge missing | Content/ops |
| Prompt confusion | AI ops |
| Tool failure | Engineering |
| Caller asked for human | CX/sales |
| Policy gap | Compliance/ops |
| Hindi language issue | Language QA |
| Latency spike | Platform/engineering |
Metrics without ownership become decoration.
India-specific metric cuts
For India, always segment metrics by:
- Hindi vs English vs Hinglish
- Region or city
- Mobile network quality
- Lead source
- Campaign type
- WhatsApp follow-up status
- Time of day
- Industry workflow
- Caller intent
- DND/consent category where applicable
Example:
An AI agent may show 78% task completion overall. But if Hinglish calls are at 52%, Delhi leads are at 84%, and Tier-2 city leads are at 47%, the aggregate number is hiding the real work.
Red flags in your metrics
Watch for these:
- Containment up, repeat calls up
- Transfer rate down, complaints up
- Latency stable, task completion down
- Tool-call failure concentrated in one workflow
- Hindi calls underperforming English calls
- High fallback after a prompt change
- High hang-up rate after first AI response
- Cost per minute down, cost per resolved call up
- Human team rejecting AI summaries
The dashboard should not only prove success. It should tell you where to improve next.
FAQ
What metrics should you track for AI voice agents?
Track task completion rate, containment rate, transfer rate, first response latency, tool-call accuracy, interruption recovery, fallback rate, sentiment, repeat-call rate, and cost per resolved call.
What is the most important AI voice agent metric?
Cost per resolved call is the most useful board-level metric because it combines call cost, successful resolution, transfers, retries, and human cleanup.
What is containment rate for voice AI?
Containment rate is the percentage of calls resolved by the AI without human transfer. It should be measured by intent, because high containment is not always good for sensitive or risky workflows.
What is a good transfer rate for AI voice agents?
There is no universal transfer rate. For simple FAQs, high transfer may signal poor automation. For healthcare, finance, or angry customers, safe transfer may be the correct outcome.
How do you measure voice AI latency?
Measure first response latency, turn latency, tool-call delay, text-to-speech start time, and long silence events. The goal is not just low latency, but natural caller-perceived timing.
How often should AI voice metrics be reviewed?
During pilot, review daily. After stabilization, review weekly by workflow. High-risk workflows such as collections, healthcare, and finance need tighter monitoring.
Final answer
AI voice agent metrics should answer one question: did the agent resolve the customer journey correctly?
Call volume is not enough. Latency is not enough. Containment is not enough.
The best dashboard connects business outcomes, conversation quality, and technical health. It shows task completion, transfers, tool accuracy, latency, sentiment, repeat calls, and cost per resolved call.
If you only measure call volume, you are measuring noise.
Related reading: AI voice agent testing checklist, Reducing voice latency, Best LLM for AI voice agents in India, and AI voice agent pricing in India.
Practical worksheets and implementation guides
Put these ideas into production
Deploy AI voice agents in minutes and build outbound, inbound, and follow-up workflows on one platform.
Related Articles
How Do You Test an AI Voice Agent Before It Goes Live?
A practical AI voice agent testing checklist for teams preparing to launch real customer calls. Learn how to test latency, Hindi and Hinglish conversations, interruptions, tool calls, handoff, and production readiness.
Reducing Voice Latency to <500ms: A Deep Dive into Edge Architecture
Achieve sub-500ms voice latency with edge computing & WebSocket optimization. Technical deep dive into building natural AI conversations with minimal delay.
Which LLM Is Best for AI Voice Agents in India?
Compare GPT, Gemini, Claude, and open models for AI voice agents in India. Learn how to choose models for latency, Hindi and Hinglish, tool calling, cost, reliability, and production routing.
AI Voice Agent Pricing in India: Per-Minute vs Monthly Plans
Compare AI voice agent pricing in India, including current VaniAgent plans, inbound and outbound call costs, usage, onboarding fees, telephony, and ROI.